Computer Chemistry Consultancy - XML4Pharma, Katzelbachweg 18, A-8052 Thal, Austria, info@CompChemCons.com
The Hoy Solubility Parameter Calculation application:
Features and Screenshots
|
|
|
|
|
|
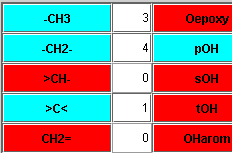
The Hoy application comes with a very user-friendly graphical user interface: |
 |
|
|
 The
mathematical method for the calculation of the δ-parameters is
different for low molecular weight components and for polymers. Therefore you
have to choose between both using the radiobuttons.
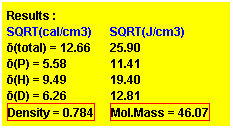 Click the Calculate
button, and the δ-parameters appear in the Result panel. They are given
as well in SQRT(cal/cm3) as in SQRT (J/cm3).
The total δ-parameter, as well as its three
(perpendicular) components are displayed. Also the density and the molar
mass are given.
If you want to obtain more information about the group contributions that were used for the calculation, just click on the 'Show Hoy Contrib.' button and you will obtain a new scrollable frame with a list of all group contributions that were used. Remember that these group contributions come as an XML-file, so that you can easily add, modify or remove chemical groups.
|
|
 The real great
power of the application comes with the use of the included
database, and which is easily extensible. The database contains
data of over 750 chemical compounds, mostly solvents and polymers. It
allows you to find the best solvents for your material. First enter the
number of best solvents that you want to obtain, in the input field, and then
click the 'Find Best Solvents' buttons. After a few seconds, a
new frame pops up with a
table sorted according
to the 'distance in 3-dimensional space'
between your compound and the compounds from the database.
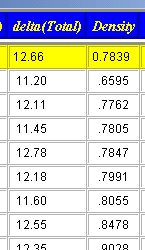 |
The compounds in the table can then be sorted (just click the corresponding column label) according to any of the properties in the table. This allows you e.g. to find a suitable solvent that has a density in the range that you desire. Remark that we can also interface the application to your own, propriety materials database. If you would like to have this feature, just contact us and we will make you an interesting offer. Of course you can make a print of the table, just use the "Print" button. |
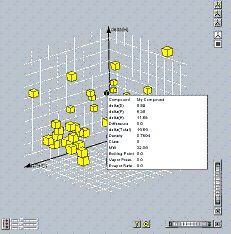
Once the table created, you also get a 3-dimensional
plot of the solvents data. You can rotate, zoom and ask
information about the plotted points (just by clicking on a plot
point), which gives an information
box with all the data from the database about that solvent or
compound. |
 |
Other features of the application
 As said before, the graphical user
interface is extremely user-friendly. For example, when pointing the mouse
over a chemical group, extra information about that chemical group is
displayed in a so-called tooltip text. This enables you to make decisions
about which group to use on the fly, without having to go looking into the
documentation of the application.
Furthermore, the
graphical user interface is fully customizable. As well the colors of
the labels, the background color as the colors of the buttons, can be
changed. Also the fonts of the labels and button labels can be
changed.
To do so, just right-click in a non-active region, and a new frame will pop up,
which allows you to change these features. On clicking 'OK' the changes are
then immediately implemented.
|
|
|
|
|
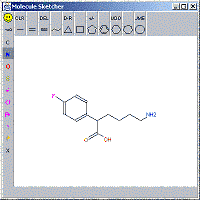
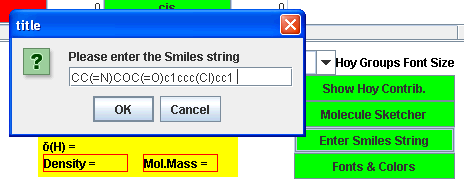 If you have your molecular data from another source (e.g. database) you can enter the molecular structure as the Smiles
string representation of the molecular structure. The structure is then automatically decomposed into Hoy groups.
  If you know the density of your
material, enter this into the 'My Density' field (click the button). This
leads to a somewhat better prediction of the solubility parameters. If you do not know
the density of your material, the program calculates it from the group
contributions.
 When you have performed a calculation,
you can obtain a